[ad_1]
Jayne Kamin-Oncea-USA TODAY Sports
It’s the most wonderful time of the year: October baseball. As always in the playoffs, I’ve been keen to observe lineup construction and offensive personnel, particularly from a bat path perspective. Over the last few years especially, the matchup game has become more and more important as managers navigate the platoon advantage that comes from switching pitchers in and out of the game. In 2023 and 2022, I explored how Vertical Bat Angle (VBA) can serve as a proxy for analyzing swing diversity in a team’s lineup. At first, it started as a way of investigating why the Astros were so consistent in the playoffs, then it became a way for me to understand which lineups have the most versatility in bat path and handedness. In theory, the more versatility, the harder it is for a pitcher-catcher combination to game plan. If a lefty with a flat bat path hits ahead of a righty with a steep bat path — as is the case with Juan Soto and Aaron Judge — a pitcher is forced to execute two different approaches. If that variance carries through an entire lineup, good luck! Spoiler alert, I’m basically describing the Dodgers, but more on that later. As I’ve said in countless blogs of mine, VBA is not a catch-all metric for describing bat path. Attack Angle (AA) and Vertical Entry Angle (VEA), among other metrics, are important for understanding the full story of each player’s path. But in this piece, I’m going to stick with just VBA because that’s what I’ve used for this piece in previous years. Here are a few key points that are important to rehash before showing the results. For left-handed hitters, I made their average VBA negative to account for the fact that they swing from the other side of the plate. (VBA data is provided by SwingGraphs.) For switch-hitters, I multiplied their average VBA by -0.72 because the league-wide rate of switch-hitter plate appearances that come against righty pitchers — when they are batting lefty — is 72%. Additionally, even though I used regular-season VBA data, I included only hitters who’ve recorded at least one playoff plate appearance this year in the sample. By not including guys who didn’t bat during the postseason, the dataset is more representative of each playoff team’s VBA variance based on how its offense is currently constructed. With the remaining group of players, I took the variance of the VBAs on the given team and adjusted it to be a percentage above or below average. The average is set at 100, just like wRC+. Without further ado, here is the update on VBAVar+ for 2024:
2024 VBAVar+ Leaderboard
- Team VBAVar+
- LAD 114.28
- DET 107.91
- SDP 107.25
- KCR 106.09
- MIL 105.86
- PHI 105.80
- BAL 105.59
- NYY 103.55
- HOU 103.44
- ATL 81.69
- CLE 67.22
- NYM 66.78
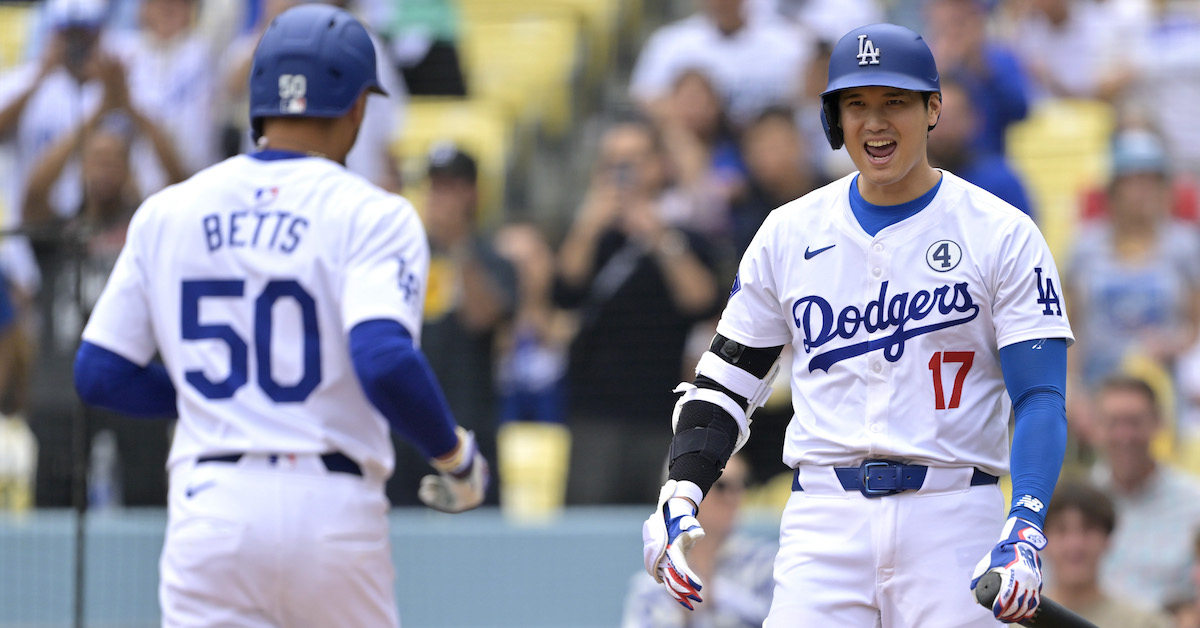
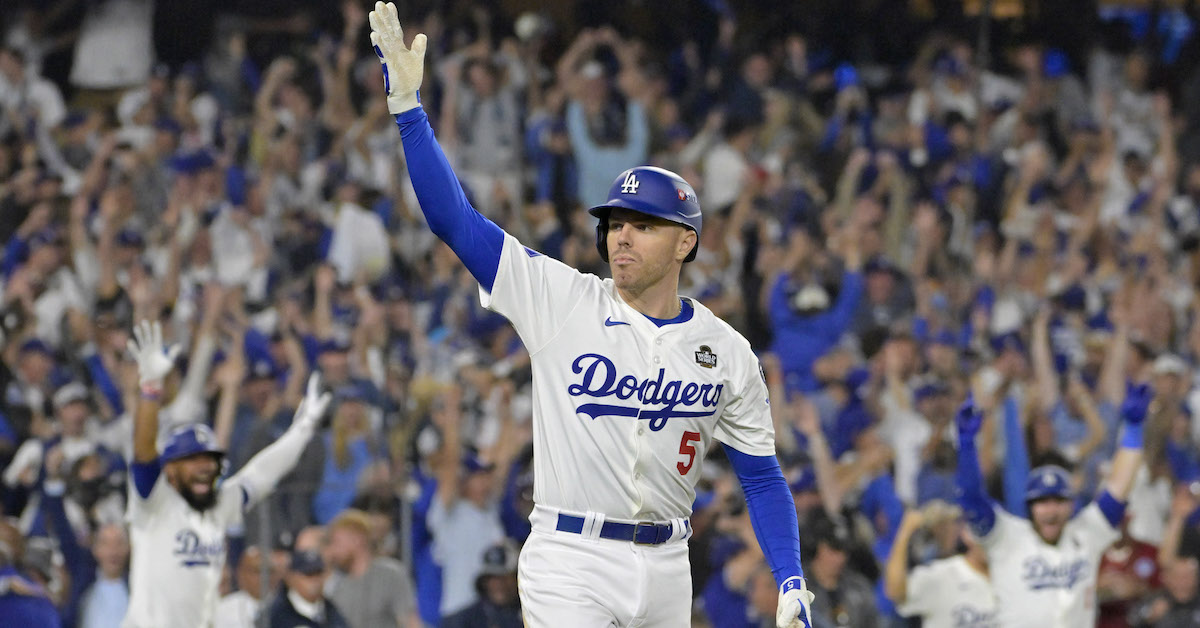
As I alluded to earlier, the Dodgers come out on top this year. Their addition of Shohei Ohtani is a big help. Shocker! He comes before Mookie Betts, who is then followed by Freddie Freeman. From a VBA perspective, these three hitters offer immediate variance atop the lineup. Ohtani’s VBA sits around 34 degrees on average (although we know he can alter his swing a ton). Betts offers a very similar VBA at just around 33.7 degrees, but his comes from the other side of the plate, and he is much shorter than Ohtani. After that, Freeman has one of the steepest swings in baseball at just over 40 degrees on average. The different angles are one way to illuminate how different they are as hitters. They force pitchers to execute multiple pitches in different locations because each of them has different strengths or weaknesses due to the shapes of their swings. Being without a healthy Freeman takes a versatile layer out of the lineup. The first baseman is nursing a sprained ankle and bone bruise, an injury that would typically warrant a recovery time of four to six weeks. He did not play in the Dodgers’ 8-0 win over the Padres in Game 4 on Wednesday, but he is in the lineup for Friday night’s Game 5. Either way, he is not at full strength. During his Game 4 absence, Max Muncy moved over to his old home at first base, while Chris Taylor and Enrique Hernández split the third base duties. As the Dodgers showed in their Game 4 rout, they have plenty of other boppers following the three stars in their lineup. It starts with Teoscar Hernández’s neutral VBA of 33-34 degrees. He is followed by Muncy’s slightly flatter swing (31 degrees). Then comes the righty Will Smith with his steeper angle of about 36 degrees. The bottom third is highlighted by Gavin Lux and Tommy Edman, who provide pitchers another different look with their flatter swings (both less than 29 degrees on average). I know, I basically listed the entire lineup, but that’s exactly the point: The Dodgers have a ton of talented hitters with different swing profiles, making it very difficult for pitchers to come up with a concrete gameplan to get them out. Last season, the Dodgers were second in this metric. The additions of Ohtani, Teoscar Hernández, and Edman, as well as the return of Lux from injury, have helped push the Dodgers to the top of the list. The Yankees also have plenty of star power in their lineup. They’ve struggled offensively thus far through their four playoff games and are just slightly above average in terms of lineup swing variance. Judge is their only hitter in this sample who has an average VBA above 33 degrees. However, as I mentioned earlier, the top of their lineup is all the more dangerous because their two best hitters, Judge and Soto, have completely different VBAs. Judge’s is 41 degrees, while Soto’s is 26, and they also come from different sides of the plate. The Padres and Royals appear third and fourth on this leaderboard, respectively. San Diego’s placement is largely due to its ability to rotate left- and right-handed hitters. On Wednesday, the Padres’ lineup went like this: L, R, L, R, L, R, L, R, L. There is one spot that sticks out especially: Batting Manny Machado fourth and Jackson Merrill fifth. Machado’s flat swing is geared toward crushing heaters, while Merrill’s steeper swing (and versatility) allows him to hit sliders well. If pitchers want to spam sliders to Machado, they’re forced to adjust quickly and take a different approach with Merrill. Yes, that’s possible. But if it makes things even just slightly more difficult for pitchers, it’s worth it. Kansas City is quite different from the other teams discussed so far because its offense is top heavy. Bobby Witt Jr. and Salvador Perez are the two key threats. If you’re not going to overwhelm pitchers offensively with a bunch of star power, at least give them varying looks, right? That’s what this lineup does. The Royals have a handful of lefty hitters with different VBAs, ranging from Kyle Isbel (very flat) to Adam Frazier (very steep). The Tigers, the other AL Central team to secure a Wild Card berth, are a similar story. The Tigers have done just enough offensively during the playoffs so far. They haven’t really had a big breakout game, but their versatility has allowed A.J. Hinch to make pinch-hitting decisions that put his team in a better position to play against the strengths of Detroit’s opponents. A good example of this came in Game 2 of the Wild Card Series against the Houston Astros, when Andy Ibáñez pinch-hit for Zach McKinstry against left-hander Josh Hader in the eighth inning. From a handedness perspective, the move is straightforward; McKinstry bats left-handed while Ibáñez is a righty. But what makes this an especially shrewd move is the fact that, from a bat path perspective, Ibáñez might be an ideal matchup for the Tigers against Hader. Hader has a flat approach angle on his fastball, which he’s trying to keep above the bats of hitters, and Ibáñez has a flat swing — on average, his VBA hovered between 26 and 27 degrees this season
[ad_2]


