[ad_1]
Daniel Kucin Jr.-USA TODAY Sports
Among the panoply of stats created by Statcast and similar tracking tools in recent years are a whole class of stats sometimes called the “expected stats.” These types of numbers elicit decidedly mixed feelings among fans – especially when they suggest their favorite team’s best player is overachieving – but they serve an important purpose of linking between Statcast data and the events that happen on the field.
Events in baseball, whether a single or a homer or strikeout or whatever, happen for reasons, and this type of data allows us to peer a little better into baseball on an elemental level. While a lucky home run or a seeing-eye single still count on the scoreboard and in the box score, the expected stats assist us in projecting what comes next.
Naturally, as the developer of the ZiPS projection tool for the last 20 (!) years, I have a great deal of interest in improving these prognostications. Statcast has its own methodology for estimating expected stats, which you’ll see all over the place with a little x preceding the stats (xBA, xSLG, xwOBA, etc). While these data don’t have the status of magic, they do help us predict the future slightly less inaccurately, even if they weren’t explicitly designed to optimize predictive value.
What ZiPS uses is designed to be as predictive as I can make it. I’ve talked a lot about this for both hitters and for pitchers. The expected stats that ZiPS uses are called zStats; I’ll let you guess what the “z” stands for!
It’s important to remember that these aren’t predictions in themselves. ZiPS certainly doesn’t just look at a hitter’s zBABIP from the last year and go, “Hey, sounds good, that’s the projection.” But the data contextualize how events come to pass, and are more stable for individual players than the actual stats. That allows the model to shade the projections in one direction or the other.
And sometimes it’s extremely important, such as in the case of homers allowed for pitchers. Of the fielding-neutral stats, homers are easily the most volatile, and home run estimators for pitchers are much more predictive of future homers than actual homers allowed are.
Also, the longer a hitter “underachieves” or “overachieves” in a specific stat, the more ZiPS believes the actual performance rather than the expected one. A good example of this last point is Isaac Paredes. There was a real disconnect between his expected and actual performances in 2023 and that’s continued into 2024. But despite some really confounding Statcast data, ZiPS now projects Parades to be a considerably more productive hitter moving forward than it did back in March.
Expected stats give us additional information; they don’t give us readings from the Oracle at Delphi. One thing to note is that bat speed is not part of the model. The data availability is just too recent to gauge how including it would improve the predictive value of these numbers. It’s also likely that even without the explicit bat speed data, the model is already indirectly capturing a lot of the information bat speed data provides.
What’s also interesting to me is that zHR is quite surprised by this year’s decline in homers. There have been 2,076 home runs hit in 2024 as I type this, yet before making the league-wide adjustment for environment, zHR thinks there “should have been” 2,375 home runs hit, a difference of 299. That’s a massive divergence; zHR has never been off by more than 150 home runs league-wide across a whole season, and it is aware that these home runs were mostly hit in April/May and the summer has yet to come. That does make me wonder about the sudden drop in offense this year. It’s not a methodology change either, as I re-ran 2023 with the current model (with any training data from 2023 removed) and there were 5,822 zHR last year compared to the actual total of 5,868 homers.
Let’s start with the over/underachievers for OPS. This is OPS calculated knowing only a player’s zBABIP, zHR, zSO, and zBB.
zOPS Overachievers (6/12, min. 150 PA)
He didn’t make the top 20, but one of the most depressing things about Spencer Torkelson’s struggles this year is that zStats think he should have actually hit worse than his already anemic triple-slash line (.201/.266/.330). Matt Olson was basically lapping the underachievers field in mid-May — when he was underperforming by nearly .300 (!) points — but he’s been hitting more like he’s expected to over the last month or so. His seasonal 2024 line is still well below what it was last year, but it’s a huge improvement over where it was about a month ago.
One of the most interesting hitters by zStats is one who didn’t make either chart, Aaron Judge. He’s been on an absolute tear, and for the season his zStats are in the neighborhood of his actual numbers. Shohei Ohtani led the league in zOPS early, but he’s hit like a mere mortal for the last calendar month, at .248/.321/.446. To better illustrate the ridiculousness of Judge’s performance thus far, let me just throw in another chart, the overall zOPS rankings.
zOPS Leaders (6/12, min. 150 PA)
In zOPS, there’s as large a gap between Judge and Ohtani, as there is between Ohtani and Jake Cronenworth in 36th place! It’s also worth noting that while Guardians utilityman David Fry is one of the larger overachievers, ZiPS still thinks he’s been a very solid hitter this year.
zBABIP Overachievers (6/12, min. 150 PA)
| Name | BABIP | zBABIP | zBABIP Diff |
|---|---|---|---|
| LaMonte Wade Jr. | .436 | .328 | .108 |
| Connor Wong | .389 | .291 | .099 |
| Isaac Paredes | .315 | .236 | .079 |
zBABIP Underachievers (6/12, min. 150 PA)
zBABIP includes information such as sprint speed in order to get a better idea of whose stats are out of whack with the inputs. CJ Abrams makes an appearance in the underachievers, suggesting that his weak May is probably more of an outlier than his blazing hot April. If Reddit conversations are a representative cross-section of fans, I expect no Mets fans will trust zStats as a result of its thinking Francisco Lindor ought to have a much higher average than his actual mark of .231.
zHR Overachievers (6/12)
| Name | HR | zHR | zHR Diff |
|---|---|---|---|
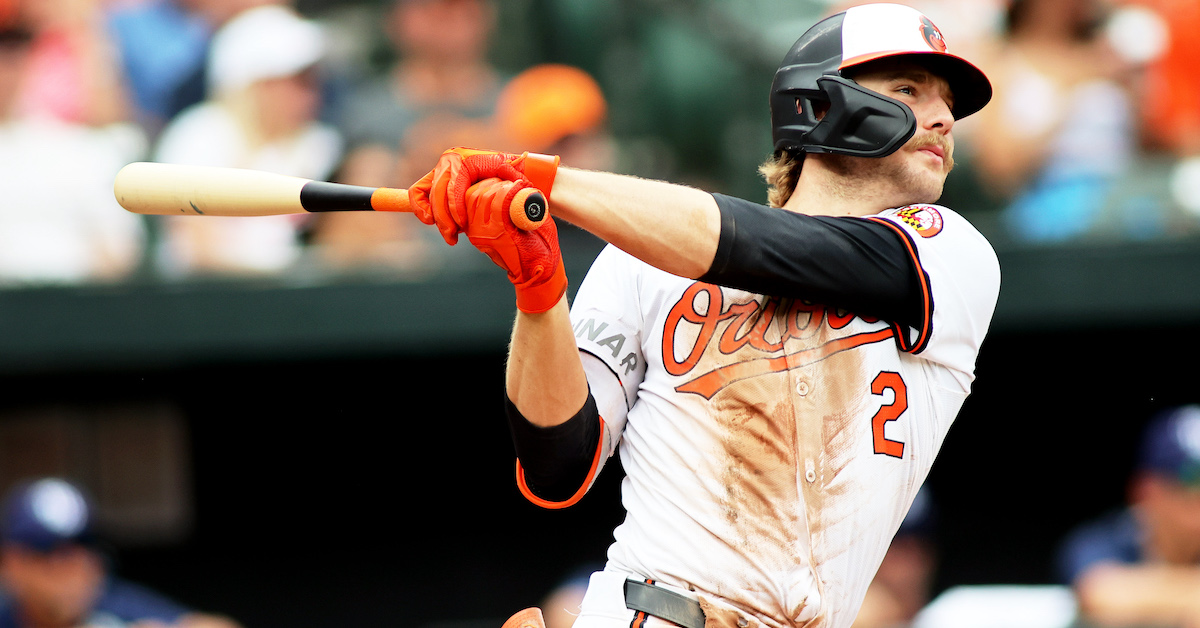
| Gunnar Henderson | 21 | 12.8 | 8.2 |
| Josh Naylor | 17 | 10.9 | 6.1 |
zHR Underachievers (6/12)
I’m from Baltimore, so as much…
[ad_2]