[ad_1]
Dan Hamilton-USA TODAY Sports
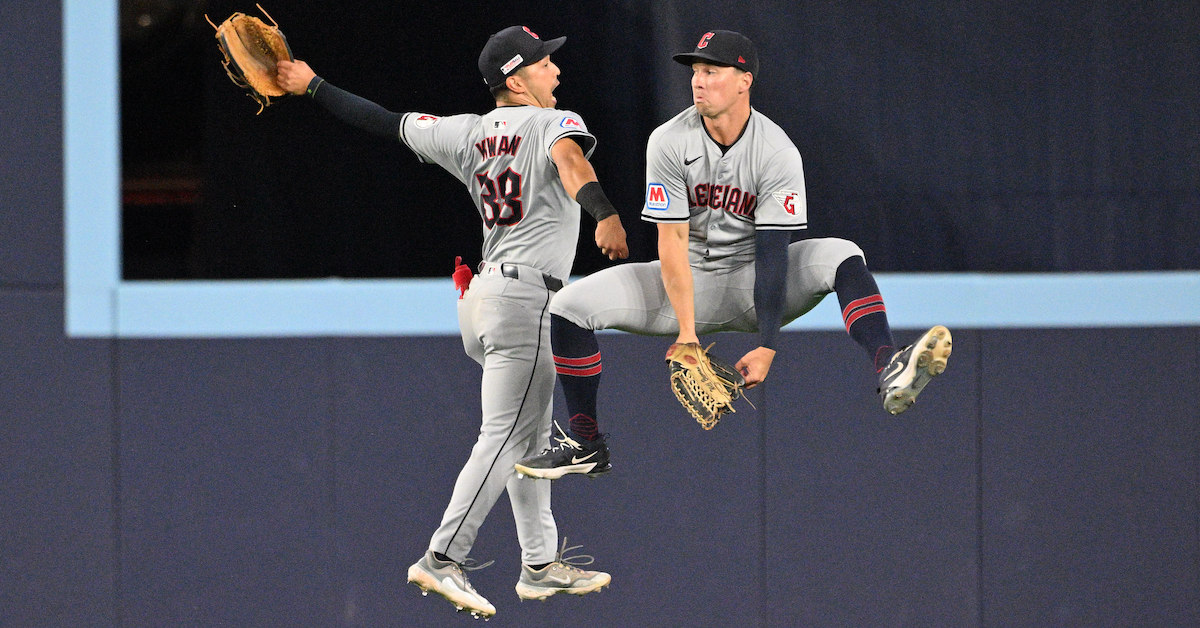
The Guardians rate as one of baseball’s bigger surprises. After finishing 76-86 last year — their worst record since 2012 — they’ve rebounded to go 57-33 thus far, and entered Wednesday with the AL’s best record. Their offense is much more potent than it was last year, and despite losing ace Shane Bieber for the season due to Tommy John surgery, they rank second in the league in run prevention at 3.87 runs per game. While Cleveland’s staff owns the AL’s second-highest strikeout rate (24.2%), a good amount of credit for the team’s run prevention belongs to its defense. By my evaluation of a handful of the major defensive metrics — Defensive Runs Saved, Ultimate Zone Rating, Statcast’s Fielding Run Value (FRV), and our catcher framing metric (hereafter abbreviated as FRM, as it is on our stat pages) — the Guardians rate as the majors’ second-best defensive team thus far this season. The Yankees, who spent much of the first half atop the AL East before a 5-16 slide knocked them into second place, are the only team ahead of them. On an individual level, even a full season of data isn’t enough to get the clearest picture of a player’s defense, and it’s not at all surprising that a 600-inning sample produces divergent values across the major metrics. After all, they’re based on differing methodologies that produce varying spreads in runs from top to bottom, spreads that owe something to what they don’t measure, as well as how much regression is built into their systems. Pitchers don’t have UZRs or FRVs, catchers don’t have UZRs, and DRS tends to produce the most extreme ratings. Still, within this aggregation I do think we get enough signal at this point in the season to make it worth checking in; I don’t proclaim this to be a bulletproof methodology so much as a good point of entry into a broad topic. Zooming in on the Guardians, they have three players who are at least two runs above average in DRS, UZR, and FRV, namely left fielder Steven Kwan, shortstop Brayan Rocchio, and right fielder Ramón Laureano (who’s now a Brave). As if it weren’t enough that Kwan is in the midst of an offensive breakout — he leads the AL with a .363 batting average and is fourth with a 172 wRC+ — the two-time Gold Glove winner is third among all left fielders in both DRS and FRV (8 and 5, respectively) despite missing about four weeks due to a left hamstring strain. Rocchio, a rookie, has hit for just an 85 wRC+ but ranks third among all shortstops in both DRS and UZR (6 and 3.6, respectively), a vast improvement from last year’s performance by the since-traded Amed Rosario. Laureano, who struggled at the plate, was released in late May; his replacement in right field, Will Brennan (who’s currently on the injured list with rib cage inflammation), is the team’s worst defender by the metrics (-5 DRS, -2.8 UZR, -2 FRV). Can’t win ’em all. The team does have one more stellar fielder, second baseman Andrés Giménez, a two-time Gold Glove winner. He’s fourth at the position with 9 DRS and tied for third with 6 FRV, though he’s only average-ish (0.3 runs) in UZR — a spread that typically offers a good example of what we see in viewing half a season through the lens of multiple metrics. Given Giménez’s data for this year and the previous ones (including last year’s exceptional 23 DRS, 14 FRV, and 6.8 UZR), the safer interpretation is that he shows up somewhere along the spectrum from slightly above average to significantly above average, if no longer elite. The Guardians also have a strong defensive tandem behind the plate in Bo Naylor and Austin Hedges. They’re excellent in framing and around average in blocking and throwing; Naylor’s caught stealing percentage has improved from 12% last year to 26% this year. Together the pair accounts for 12 DRS, 11 FRV, and 6.8 FRM. Super-duper utilityman David Fry, who’s played 22 games at catcher while also taking reps at all four corners, is solid defensively while providing some much-needed offense — so much that he hit his way onto the AL All-Star team. A bit more about the methodology is in order. To account for all the bits in the alphabet soup, I aggregated the aforementioned metrics, adjusting for the varying spreads in run values by using standard deviation scores (z-scores), which measure how many standard deviations each team is from the league average in each category. As a change from past editions of this exercise, I’ve broken out catching DRS from the rest of a team’s DRS (as I had previously done with Statcast’s metrics), thus creating three catcher scores that pair with three scores for the other fielders. These catcher ratings were then weighted at one-half the value of the non-catcher scores, which improved the correlation with run prevention. The spreads in runs for the six categories: Defensive Metrics Run Value Ranges Metric Split Max Min DRS_non-C Non-Catchers 46 -39 DRS_C Catchers 14 -13 UZR Non-Catchers 14.8 -20.4 FRM Catchers 6.7 -4.6 FRV_non-C Non-Catchers 25 -27 FRV_C Catchers 11 -8 All statistics through July 7. Here’s how the rankings look, top to bottom; you can see the actual run values for all but the DRS and FRV catcher breakouts here. I’ve highlighted each category’s leaders and trailers, which helps to illustrate where the metrics agree — all three systems concur regarding the three best sets of catchers, and the White Sox are unsurprisingly among the worst in everything — and disagree. Team Defense Standard Deviation Scores Team DRS_nonC-z DRS_C-z UZR-z FRM-z FRV_nonC-z FRV_C-z Tot Yankees 0.60 2.24 1.20 2.29 1.28 2.06 6.38 Guardians 1.36 1.76 0.76 2.09 0.60 1.87 5.57 Blue Jays 1.83 0.96 0.67 0.82 1.43 1.32 5.48 Royals 1.26 1.12 1.39 -0.41 1.28 0.76 4.67 Rangers 1.17 0.00 1.01 1.03 1.89 -0.34 4.41 Diamondbacks -0.16 0.32 1.64 -0.17 0.98 0.21 2.63 Orioles 0.74 0.00 1.46 -0.51 0.83 -0.90 2.32 Dodgers 1.02 0.16 0.88 0.45 -0.16 0.02 2.06 Rockies -0.21 0.32 1.47 0.07 0.29 0.58 2.04 Braves 1.02 0.16 0.17 0.31 0.22 0.58 1.94 Brewers 1.50 -1.12 -0.03 -0.54 1.51 -0.90 1.70 Tigers -0.45 1.44 -0.28 1.40 -0.39 1.87 1.25 Mariners 0.22 1.12 -0.59 1.20 -0.39 1.32 1.06 Giants -0.45 0.96 0.05 0.17 0.07 0.39 0.43 Cardinals 0.60 -0.64 0.41 -0.07 -0.31 -0.16 0.26 Twins -0.68 0.64 -1.13 0.99 0.75 0.58 0.04 Astros -0.16 -0.80 0.87 -0.34 0.37 -1.08 -0.03 Phillies 0.31 -0.16 -0.64 -1.26 0.67 -0.16 -0.45 Red Sox 0.55 0.00 -0.30 -0.41 -0.62 -0.90 -1.02 Rays -0.97 0.32 -0.94 0.89 -0.09 0.21 -1.29 Padres -0.02 -1.44 0.27 -1.26 -0.09 -1.27 -1.82 Pirates -0.68 -0.32 0.03 0.00 -1.23 -0.16 -2.11 Angels 0.12 0.16 -0.66 -0.68 -1.45 -0.90 -2.70 Cubs -0.30 -0.80 -0.63 -1.37 -0.24 -1.08 -2.80 Mets -1.06 -1.12 -1.09 -0.54 -0.77 0.21 -3.65 Reds -1.16 -0.80 -1.16 -0.85 -0.62 -0.34 -3.93 Nationals -0.92 -0.96 -0.21 -1.57 -1.23 -1.27 -4.26 Athletics -1.44 -1.12 -0.72 0.00 -1.45 -1.08 -4.72 Marlins -1.44 -0.32 -2.28 -0.34 -1.07 0.02 -5.11 White Sox -2.20 -2.08 -1.61 -1.40 -2.06 -1.45 -8.34 All statistics through July 7. Yellow = top-three ranking in category (including ties). Blue = bottom-three ranking in category (including ties). What follows is a closer look at the other teams in the top six by this rating. I’ll have a companion article covering the bottom-ranked teams in my next installment.
[ad_2]


